Instructions on operating the applet 
The applet consists of what we call the display area (with gray background) and menus with buttons, text boxes and value control bars (with blue background). However, it should be noted that, as we will see later, in some cases it is also possible to enter data directly in the visualization area.
Click the image where you have questions.
Note: The following figures are non-manipulable images. In the figures marked with , if you hover the mouse over them you will see an animation.
The display zone is divided into five areas:
- The area on the left represents a pendulum formed by a ball of mass
m, suspended by a bar of length L, subject to the action of gravity of value
g and moving on a spherical surface. For a fixed L,
the position of the ball at each instant is determined by the pair (θ, φ), θ
being the angle that the rod makes with the positive z-semi-axis and
φ the angle of the semi-plane defined by the z-axis and by the rod with the semi-plane defined by the
z-axis and the positive x-semi-axis.
Rotate the spherical surface with the mouse (if the cursor is in the shape of
 )
for a better view in space and drag the pendulum ball with the mouse to the desired initial position, as long as the
cursor is in the shape of
)
for a better view in space and drag the pendulum ball with the mouse to the desired initial position, as long as the
cursor is in the shape of  :
more details.
:
more details.
- in the central area is a representation of the potential, kinetic and total energies of the pendulum
at each instant.
Dragging the mouse in this area vertically makes it possible to zoom;
- in the right area (from top to bottom) are represented:
- the graph of the trajectory in the plane (θ, θ');
- the graph of the trajectory in the plane (φ, φ');
- the projection of the pendulum trajectory onto the xy plane.
The initial parameters of the pendulums can be modified:
- in the case of the initial values of θ and φ,
- directly in the text boxes:
 and
and
 ;
; - dragging the pendulum ball, as long as the cursor has the shape
:
more details;
- clicking on the first two areas on the right (as long as the cursor has the shape
:
more details). In this case, the x-coordinate of the green points
determines the new initial values of
θ
and φ
and the y-coordinates determine the new initial values of θ'
and φ'.
- directly in the text boxes:
- in the case of the initial values of θ'
and φ',
- directly in the text boxes:
 and
and 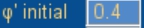 ;
;
- clicking on the first two areas on the right (as long as the cursor has the shape
:
more details).
In this case, the y-coordinates of the points in green determine the new initial values of
θ'
and φ'
and the abscissa of the points in green determine the new initial values of
θ and
φ.
- directly in the text boxes:
- in the case of the value of length L, mass m
and gravity (g):
- entering the values in the text boxes;
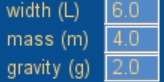
- dragging the control bars.
Once these values have been chosen, click
![]() , to see the simulation of the movement of the pendulums.
, to see the simulation of the movement of the pendulums.
The menu ![]() has the following options:
has the following options:
 : to reset the time value (t = 0);
 : to return to the initial configuration.
Important note: to choose a point in one of the areas on the right of the
applet,
always check that the mouse cursor has the following shape:![]() .
If it has another shape, like
.
If it has another shape, like ![]() ,
click
,
click ![]() first.
If it is
first.
If it is ![]() and you want to change to
and you want to change to ![]() ,
simply right-click and in the window that appears choose the Rotate, Orbit option.
,
simply right-click and in the window that appears choose the Rotate, Orbit option.
In the three areas on the right of the applet, try clicking on them with the right mouse button: you get a menu with other options for manipulating objects.

Among the options, ![]() allows you to have a resizable window of the area where you clicked - for more information,
click here.
allows you to have a resizable window of the area where you clicked - for more information,
click here.
The flag, at the top of the applet, indicates the language used. If you wish, click it and select another language:
By clicking
![]() , you can choose between:
, you can choose between:
 :
access this instruction page;
:
access this instruction page; :
accesses information about the applet version*.
:
accesses information about the applet version*.